
Previously, I wrote and graphed about Pennsylvania traffic patterns during COVID-19.
This past November, rising rates of COVID-19 prompted government leaders in Pennsylvania to issue strict guidelines for travel during the holidays. Motorists were encouraged to stay at home, get tested for out-of-state travel, or to quarantine. So how were traffic levels impacted as a result? The Pennsylvania Department of Transportation’s (PennDOT) Traffic Information Repository offers answers.
Holiday Traffic: 2019 vs 2020
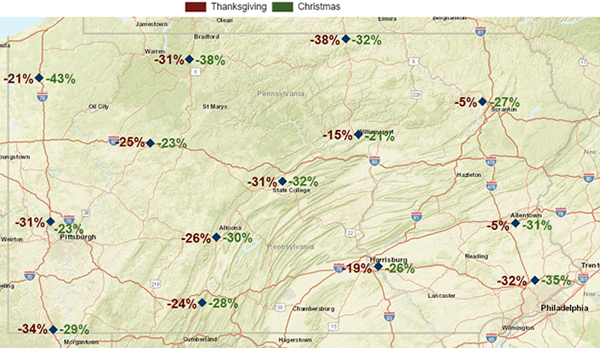
I collected traffic data from a sample of 14 continuous traffic counters throughout Pennsylvania. The goal was to compare 2020 holiday traffic levels to 2019 holiday traffic levels. Rather than only looking at Thanksgiving Day and Christmas Day, I collected traffic counts for the five days surrounding each holiday. The resulting analysis is the percentage drop from 2019 to 2020 for the 14 sampled locations. The results are shown on this map below.
Thanksgiving Traffic: 2019 vs 2020
The following bar chart aggregates the traffic counts for all of the 14 site samples for the days surrounding Thanksgiving, Wednesday through Sunday. The percentage shows the decline from 2019 to 2020. Note that Thanksgiving Day has the largest percentage decline.

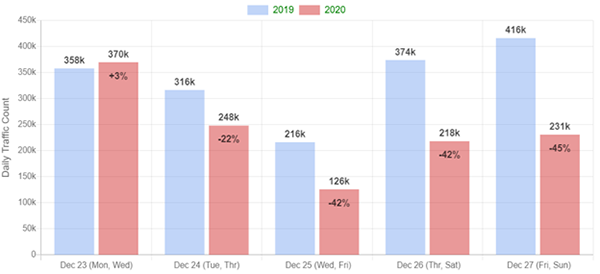
Christmas Traffic: 2019 vs 2020
For Christmas, I sampled the same 14 continuous traffic counters and aggregated the counts for Dec. 23 through Dec. 27. Since Christmas falls on a different day each year, the day of the week is shown in the x-axis labels.
New Year's Eve Traffic: 2019 vs 2020
I also tracked differences in traffic count for New Year's Eve. For something a little different, I compared the hourly counts during the evening of New Year's Eve. As parties and "drop" events were canceled, the year-to-year differences increase near midnight.

Returning to Baseline in 2021?
When will we see a return to pre-pandemic levels? Vaccinations are beginning to roll out, but we are also getting reports of the new COVID-19 variant appearing in Pennsylvania. Will we return to baseline in 2021? Readers, stay tuned!
Esri's ArcGIS API for JavaScript was used to create the map with labels.